


Periods of unusually calm markets can sometimes be a warning that volatility is about to increase.
There is a study titled “Forecasting a Volatility Tsunami”, which examined whether periods of unusually low volatility can help identify when a significant increase in market volatility may be approaching. The study focused on the CBOE Volatility Index (VIX), often referred to as Wall Street’s “fear gauge”, along with the VVIX, which measures the expected volatility of the VIX itself.
The research found an interesting pattern: many of the largest increases in the VIX were preceded by extended periods when both the VIX and VVIX were unusually stable. In other words, when volatility itself becomes exceptionally quiet, history suggests investors should not necessarily assume those calm conditions will continue.
Although the original study only included data through 2016, Nasdaq Dorsey Wright previously tested the methodology using data from 2007 through 2024 and found that the results generally supported the original findings. With the VIX recently falling to its lowest level of 2026, we thought it was an appropriate time to revisit the analysis.
Using daily VIX and VVIX data going back to 2007, Nasdaq Dorsey Wright identified periods when the 20-day variability of both indexes simultaneously fell into the lowest 15% of their historical ranges. These unusually quiet periods have occurred several times since 2016, and they have frequently been followed by an increase in market volatility.
Some of those increases were relatively modest, while others were much more significant. In early 2018, for example, the VIX more than doubled. More recently, both measures again entered this unusually quiet range during the final week of August.
We may already be seeing the early stages of volatility returning. Through September 9th, the VIX had risen a little more than 8% over the previous seven days, and it moved higher again during recent trading.
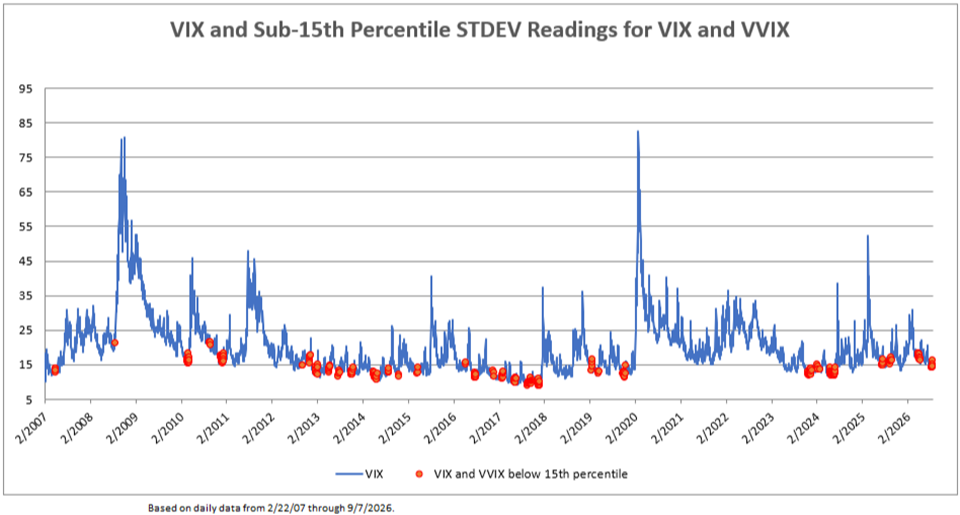
Source: Nasdaq Dorsey Wright
Looking more closely at previous occurrences provides additional perspective. Nasdaq Dorsey Wright examined how much the VIX increased or decreased during the 30 days following periods when both volatility measures were in the lowest 15% of their historical ranges.
The results showed a noticeable tendency toward higher volatility. On average, the maximum increase in the VIX over the following 30 days was approximately 29% when measured from the beginning of these unusually quiet periods and approximately 45% when measured from the end.

Source: Nasdaq Dorsey Wright
What Could This Mean for Investors?
The VIX reached 18 during recent trading, but history suggests there could still be room for volatility to increase. For perspective, a roughly 47% increase from a VIX level of 14.5—near where it closed over a week ago—would bring the index to approximately 21.4.
That does not mean the VIX is destined to reach 21, nor does it mean volatility could not move considerably higher. Historical averages are useful for providing context, but they are not forecasts or guarantees.
The more important takeaway is that the unusually calm market environment we experienced in late August and early September has historically been followed by periods of increased volatility.
For long-term investors, an increase in volatility does not necessarily change the investment outlook or warrant changes to a well-constructed portfolio. Rather, it serves as a reminder that periods of market calm do not last indefinitely. Staying diversified, maintaining appropriate risk levels, and remaining focused on long-term financial objectives can be especially important when markets become more unsettled.
As always, we will continue to monitor market conditions and the underlying indicators for signs of meaningful changes in the investment environment.
The current reading for the PR4050 is: U.S. Equity Core = 98.59% & Money Market = 13.38%. For the PR4050 indicator to trigger and alert us when we should consider moving to cash, U.S. Equity Core must be 40% or below and Money Market must be 50% or above.

Source: Nasdaq Dorsey Wright
Below is the most recent D.A.L.I. (Dynamic Asset Level Investing) Indicator showing International Equities and Domestic Equities in the top two spots, while both maintain a commanding lead over Cash and Fixed Income.

Source: Nasdaq Dorsey Wright
P.S. If you believe this information would be of benefit to anyone you know, please share this communication with them. Also, if you, or someone you know, would like to be added to the weekly market update, please click here to provide us with the e-mail address.
Main Street Wealth Advisors
33801 1st Way South, Suite 271
Federal Way, WA 98003
Office: (253) 944-1047
Fax: (253) 944-1075
ART-1174128
Securities and advisory services offered through LPL Financial, a Registered Investment Advisor, Member FINRA/SIPC.
These views are those of the author, not of the broker-dealer or its affiliates. This material contains an assessment of the market and economic environment at a specific point in time and is not intended to be a forecast of future events, or a guarantee of future results. All investments involve risk, including loss of principal. Forward-looking statements are subject to certain risks and uncertainties. Actual results, performance, or achievements may differ materially from those expressed or implied. Information is based on data gathered from what we believe are reliable sources. All indices are unmanaged and may not be invested into directly.
Technical analysis is based on the study of historical price movements and past trend patterns. There is no assurance that these movements or trends can or will be duplicated in the future. Nasdaq Dorsey Wright developed the indicators described above. They have been prepared without regard to any particular investor's investment objectives, financial situation, and needs. Accordingly, investors should not act on any recommendation (express or implied) or information in this report without obtaining specific advice from their financial advisors and should not rely on information herein as the primary basis for their investment decisions.
Nasdaq Dorsey Wright’s “DALI" employs relative strength-based analysis to rank macro asset classes based on developing leadership trends within the global capital markets. The objective guidance within DALI provides the tools necessary to properly allocate portfolios across all major asset classes in an effort to emphasize strength wherever it exists. Domestic Equities, International Equities, Commodities, Currencies, Fixed Income and Cash are evaluated daily to identify dynamic developments across investment genres, as well as within them. This tool provides the tactical precision that allows investors to adapt as the market leadership changes.
International investing involves special risks such as currency fluctuation and political instability and may not be suitable for all investors. These risks are often heightened for investments in emerging markets.
This material is for general information only and is not intended to provide specific advice or recommendations for any individual. There is no assurance that the views or strategies discussed are suitable for all investors or will yield positive outcomes. Investing involves risks including possible loss of principal. Any economic forecasts set forth may not develop as predicted and are subject to change.
The NASDAQ Composite Index measures all NASDAQ domestic and non-U.S. based common stocks listed on The NASDAQ Stock Market. The market value, the last sale price multiplied by total shares outstanding, is calculated throughout the trading day, and is related to the total value of the Index.
The S&P 500® Index: A free-float capitalization-weighted index published since 1957 of the prices of 500 large-cap common stocks actively traded in the United States. The stocks included in the S&P 500® are those of large publicly held companies that trade on either of the two largest American stock market exchanges: the New York Stock Exchange and the NASDAQ.
MSCI World Index: A broad global equity index that represents large and mid-cap equity performance across 23 developed markets countries.
Bonds are subject to market and interest rate risk if sold prior to maturity. Bond values will decline as interest rates rise and bonds are subject to availability and change in price.