

Despite recent market volatility and sharp pullbacks in several mega-cap technology stocks, the S&P 500 remains only about 3% below the all-time high it reached in June after rebounding nearly 20% from its March low.
Because the market recovered so quickly after its first-quarter decline, many investors may feel they missed the opportunity to "buy the dip." Now, with stocks once again near record highs and renewed geopolitical tensions in the Middle East creating uncertainty, it's understandable that some investors are hesitant to put new money to work.
In the short term, there are valid reasons for caution. From both a fundamental and technical perspective, the market may face headwinds that could limit further gains. However, history shows that there have been surprisingly few truly poor times to invest for those with a long-term perspective.
At Main Street Wealth Advisors, we do not believe in simply buying and holding the S&P 500 regardless of market conditions. As active portfolio managers, we continually evaluate market trends, rotating toward areas demonstrating relative strength while adjusting overall portfolio exposure as conditions change. Rather than waiting for the "perfect" time to invest—a moment that rarely exists—we believe it is more valuable to understand how markets have historically rewarded patient investors, even when they began investing during periods of uncertainty.
Source: Nasdaq Dorsey Wright
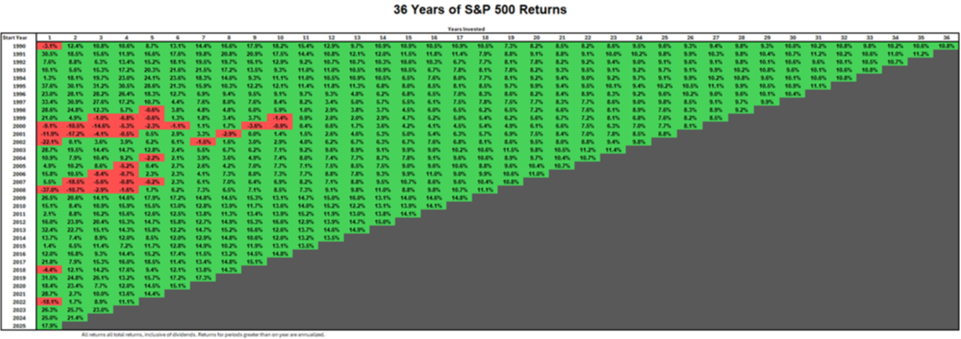
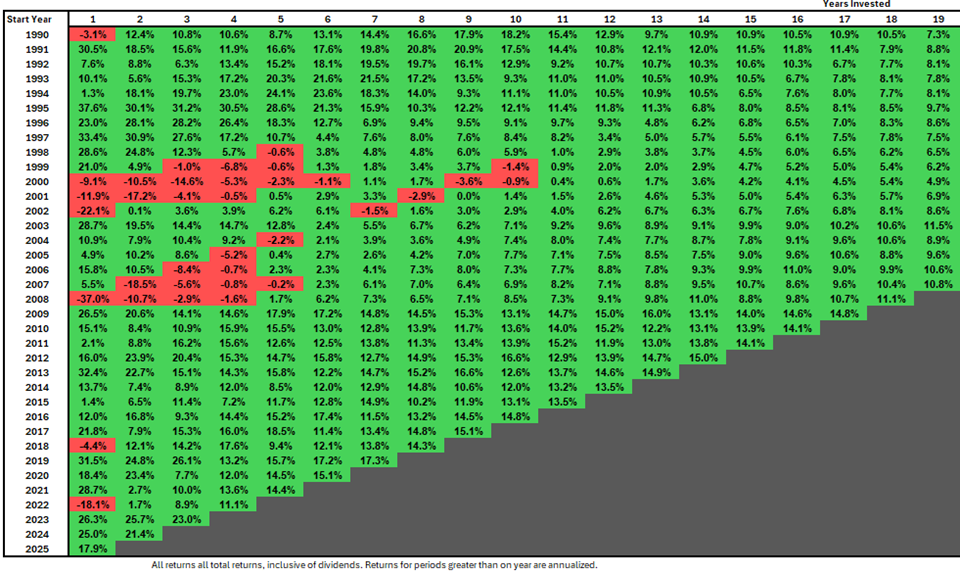
The chart below illustrates the annualized returns of the S&P 500 Total Return Index for every starting year from 1990 through 2025. For example, an investment made at the end of 1989 (the 1990 starting point) reflects 36 years of performance, while an investment beginning at the end of 1990 reflects 35 years, and so on.
One of the most important takeaways is that, regardless of when an investment was made, most starting points produced positive annualized returns within just a few years.
Source: Nasdaq Dorsey Wright
Of course, history has included periods that tested investors' patience. Those who invested around the peaks of the dot-com bubble (2000–2002) or just before the Global Financial Crisis (2008) experienced several years of negative returns before markets recovered.
Even so, the long-term results remain compelling. After 25 years, investors who entered the market during the technology bubble earned annualized returns of roughly 7.7%. While that trailed investors who entered just a few years earlier by approximately 2% per year—a meaningful difference over time—it still substantially outperformed remaining in cash over the same period.
Perhaps the most encouraging lesson is how few truly "bad" entry points history has produced. Investors who entered the market in 2007, immediately before the Global Financial Crisis, have still earned annualized returns approaching 11% over the past 19 years. Likewise, investors who began in 2022—just before another significant market decline—have already achieved annualized returns exceeding 11%.
It's also important to remember that these figures represent a simple buy-and-hold investment in the S&P 500. Investors who employed a disciplined, tactical investment approach—reducing exposure to weaker areas of the market and emphasizing stronger sectors—may have achieved even better long-term outcomes during challenging periods such as the dot-com collapse.
While no one can predict what the market will do over the next few months, history suggests that long-term success is less about finding the perfect entry point and more about maintaining a disciplined investment strategy through changing market environments.
The current reading for the PR4050 is: U.S. Equity Core = 98.59% & Money Market = 7.04%. For the PR4050 indicator to trigger and alert us when we should consider moving to cash, U.S. Equity Core must be 40% or below and Money Market must be 50% or above.
Source: Nasdaq Dorsey Wright
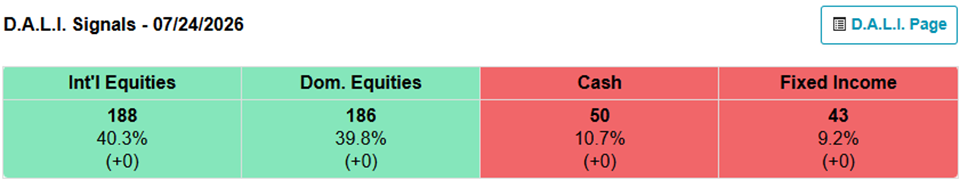
Below is the most recent D.A.L.I. (Dynamic Asset Level Investing) Indicator showing International Equities and Domestic Equities in the top two spots, while both maintain a commanding lead over Cash and Fixed Income.
Source: Nasdaq Dorsey Wright
P.S. If you believe this information would be of benefit to anyone you know, please share this communication with them. Also, if you, or someone you know, would like to be added to the weekly market update, please click here to provide us with the e-mail address.
Main Street Wealth Advisors
33801 1st Way South, Suite 271
Federal Way, WA 98003
Office: (253) 944-1047
Fax: (253) 944-1075
www.mainstreetwa.com
ART-1146784
Securities and advisory services offered through LPL Financial, a Registered Investment Advisor, Member FINRA/SIPC.
These views are those of the author, not of the broker-dealer or its affiliates. This material contains an assessment of the market and economic environment at a specific point in time and is not intended to be a forecast of future events, or a guarantee of future results. All investments involve risk, including loss of principal. Forward-looking statements are subject to certain risks and uncertainties. Actual results, performance, or achievements may differ materially from those expressed or implied. Information is based on data gathered from what we believe are reliable sources. All indices are unmanaged and may not be invested into directly.
Technical analysis is based on the study of historical price movements and past trend patterns. There is no assurance that these movements or trends can or will be duplicated in the future. Nasdaq Dorsey Wright developed the indicators described above. They have been prepared without regard to any particular investor's investment objectives, financial situation, and needs. Accordingly, investors should not act on any recommendation (express or implied) or information in this report without obtaining specific advice from their financial advisors and should not rely on information herein as the primary basis for their investment decisions.
Nasdaq Dorsey Wright’s “DALI" employs relative strength-based analysis to rank macro asset classes based on developing leadership trends within the global capital markets. The objective guidance within DALI provides the tools necessary to properly allocate portfolios across all major asset classes in an effort to emphasize strength wherever it exists. Domestic Equities, International Equities, Commodities, Currencies, Fixed Income and Cash are evaluated daily to identify dynamic developments across investment genres, as well as within them. This tool provides the tactical precision that allows investors to adapt as the market leadership changes.
International investing involves special risks such as currency fluctuation and political instability and may not be suitable for all investors. These risks are often heightened for investments in emerging markets.
This material is for general information only and is not intended to provide specific advice or recommendations for any individual. There is no assurance that the views or strategies discussed are suitable for all investors or will yield positive outcomes. Investing involves risks including possible loss of principal. Any economic forecasts set forth may not develop as predicted and are subject to change.
The NASDAQ Composite Index measures all NASDAQ domestic and non-U.S. based common stocks listed on The NASDAQ Stock Market. The market value, the last sale price multiplied by total shares outstanding, is calculated throughout the trading day, and is related to the total value of the Index.
The S&P 500® Index: A free-float capitalization-weighted index published since 1957 of the prices of 500 large-cap common stocks actively traded in the United States. The stocks included in the S&P 500® are those of large publicly held companies that trade on either of the two largest American stock market exchanges: the New York Stock Exchange and the NASDAQ.
MSCI World Index: A broad global equity index that represents large and mid-cap equity performance across 23 developed markets countries.
Bonds are subject to market and interest rate risk if sold prior to maturity. Bond values will decline as interest rates rise and bonds are subject to availability and change in price