


September’s Reputation: History, Diversification, and Opportunity
As we approach September, investors may begin hearing more about the month’s historically challenging reputation. Over the years, September has been the weakest calendar month, on average, for several major U.S. stock market indexes, including the S&P 500 Index, Dow Jones Industrial Average, and Nasdaq Composite (Source: Stock Trader’s Almanac)
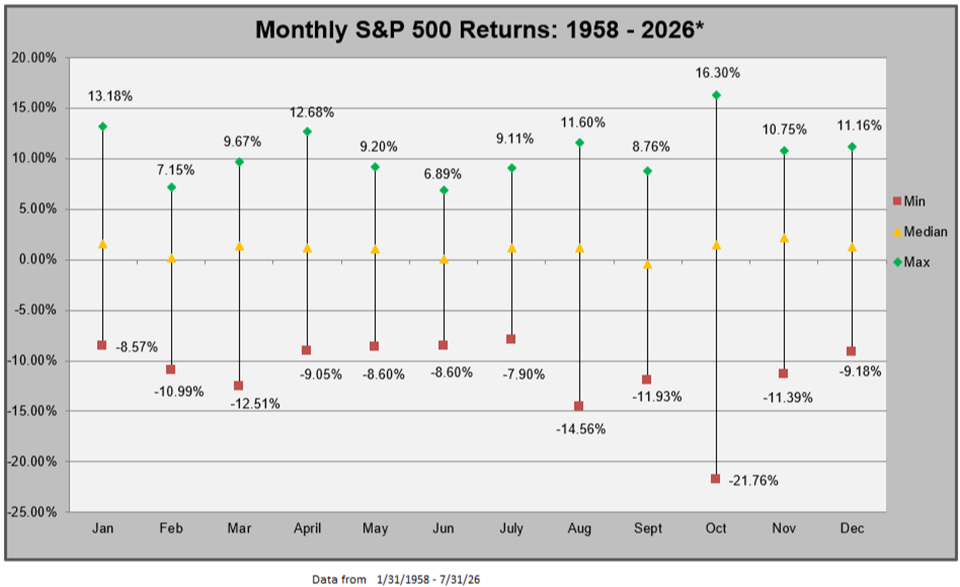
Since 1958, September is the only month in which the S&P 500 has produced a negative median return. More recently, the index declined 3.92%, 4.76%, 9.34%, and 4.9% during September from 2020 through 2023, respectively. However, the pattern has not been consistent: the S&P 500 posted gains in September 2024 and 2025.
Source: Nasdaq Dorsey Wright
Looking Beyond Stocks
Periods of stock market weakness can highlight the potential benefits of diversification. Historically, certain asset classes have performed differently from stocks during September, with gold being one notable example.
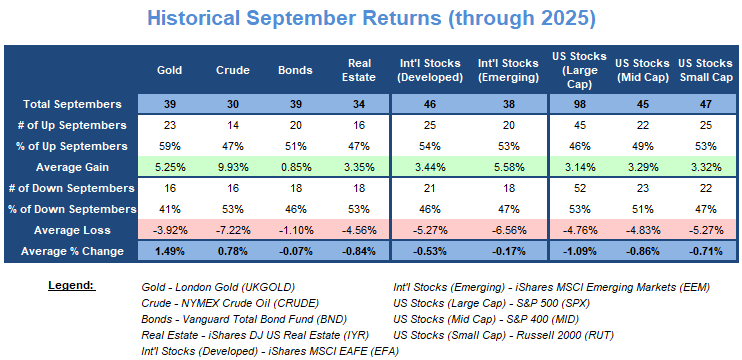
Since 1987, gold has produced a positive September return in 22 of 38 years, or approximately 58% of the time. Its average September return over the period has been approximately 1.5%, while positive Septembers have averaged roughly 5.25%.
Gold did decline during each September from 2020 through 2023, illustrating that diversification does not guarantee positive returns. However, it generally held up better than stocks during those years. In September 2022, for example, gold outperformed the S&P 500 by more than seven percentage points. Last September, gold gained more than 11%, again substantially outperforming the S&P 500.
Historical data across other asset classes also shows that gold, oil, and bonds have, at times, provided stronger September results than stocks.
Source: Nasdaq Dorsey Wright
How Much Markets Move Matters Too
Simply looking at how often an investment rises or falls does not tell the entire story. The magnitude of those gains and losses can be equally important.
Developed International Equities (stocks) provide a good example. Historically, they have posted gains during approximately 54% of Septembers going back to 1980, with an average gain of about 3.4% during positive years. However, during negative Septembers, the average decline has been approximately 5.3%. The larger average losses have resulted in an overall average September return of approximately -0.5%.
Similar patterns have historically appeared in emerging-market and U.S. small-cap stocks. This is a useful reminder that the frequency of positive returns should always be considered alongside the size of potential gains and losses.
September Hasn't Always Been Negative
Despite its reputation, September is certainly not destined to be a negative month. There have been several notably strong Septembers, including 2007, 2009, 2010, and 2025, when the S&P 500 gained more than 3%. Perhaps more importantly, weakness in the broad market has not always meant weakness everywhere.
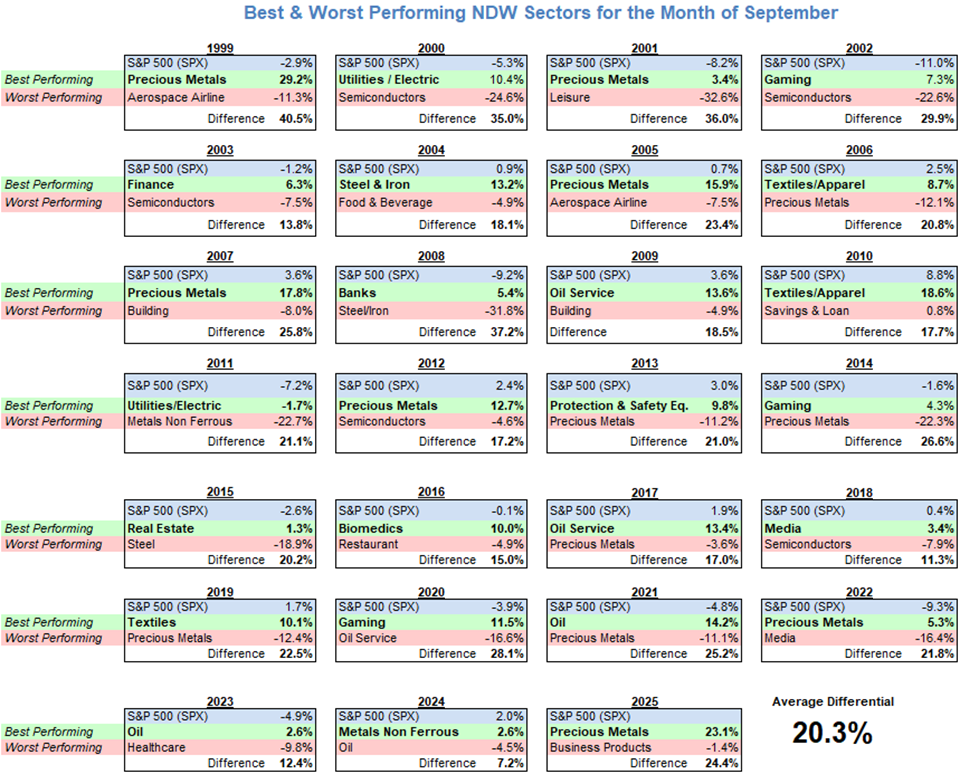
Sector performance can vary considerably, creating opportunities even during difficult markets. In September 2008, for example, the S&P 500 declined approximately 9.2%, while the Bank sector gained more than 5%. At the same time, the Steel and Iron sector declined nearly 32%, illustrating just how dramatically leadership can differ beneath the surface of the broader market. A similar example occurred in September 2023. While the S&P 500 declined nearly 5%, the Oil sector gained more than 2.5%.
Over the past 25 years, the average September performance difference between the strongest and weakest industry groups has been approximately 20 percentage points. That degree of dispersion reinforces an important point: what you own can matter considerably, even when the overall market is struggling.
Source: Nasdaq Dorsey Wright
What Does This Mean for Investors?
September's historical record is worth recognizing, but it should not be viewed as a prediction of what will happen this year. Seasonal patterns describe what markets have done in the past; they do not determine what comes next.
Rather than making investment decisions based on the calendar alone, we believe it is more useful to focus on current market trends, relative strength, diversification, and changes in leadership across asset classes and sectors.
History tells us September has often presented challenges for stock investors. It also tells us that opportunities can still emerge beneath the surface. Maintaining a disciplined, diversified investment strategy—and remaining attentive to where relative strength is developing—can be more productive than attempting to predict the market based solely on seasonal tendencies.
As always, we will continue to monitor market conditions and portfolio positioning as we move into the final months of the year
The current reading for the PR4050 is: U.S. Equity Core = 99.30% & Money Market = 7.75%. For the PR4050 indicator to trigger and alert us when we should consider moving to cash, U.S. Equity Core must be 40% or below and Money Market must be 50% or above.

Source: Nasdaq Dorsey Wright
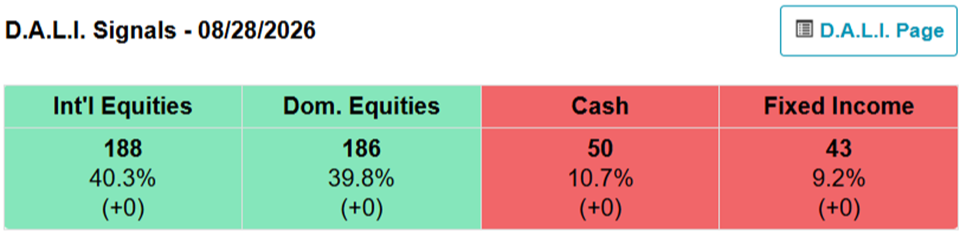
Below is the most recent D.A.L.I. (Dynamic Asset Level Investing) Indicator showing International Equities and Domestic Equities in the top two spots, while both maintain a commanding lead over Cash and Fixed Income.
Source: Nasdaq Dorsey Wright
P.S. If you believe this information would be of benefit to anyone you know, please share this communication with them. Also, if you, or someone you know, would like to be added to the weekly market update, please click here to provide us with the e-mail address.
Main Street Wealth Advisors
33801 1st Way South, Suite 271
Federal Way, WA 98003
Office: (253) 944-1047
Fax: (253) 944-1075
ART-1167097
Securities and advisory services offered through LPL Financial, a Registered Investment Advisor, Member FINRA/SIPC.
These views are those of the author, not of the broker-dealer or its affiliates. This material contains an assessment of the market and economic environment at a specific point in time and is not intended to be a forecast of future events, or a guarantee of future results. All investments involve risk, including loss of principal. Forward-looking statements are subject to certain risks and uncertainties. Actual results, performance, or achievements may differ materially from those expressed or implied. Information is based on data gathered from what we believe are reliable sources. All indices are unmanaged and may not be invested into directly.
Technical analysis is based on the study of historical price movements and past trend patterns. There is no assurance that these movements or trends can or will be duplicated in the future. Nasdaq Dorsey Wright developed the indicators described above. They have been prepared without regard to any particular investor's investment objectives, financial situation, and needs. Accordingly, investors should not act on any recommendation (express or implied) or information in this report without obtaining specific advice from their financial advisors and should not rely on information herein as the primary basis for their investment decisions.
Nasdaq Dorsey Wright’s “DALI" employs relative strength-based analysis to rank macro asset classes based on developing leadership trends within the global capital markets. The objective guidance within DALI provides the tools necessary to properly allocate portfolios across all major asset classes in an effort to emphasize strength wherever it exists. Domestic Equities, International Equities, Commodities, Currencies, Fixed Income and Cash are evaluated daily to identify dynamic developments across investment genres, as well as within them. This tool provides the tactical precision that allows investors to adapt as the market leadership changes.
International investing involves special risks such as currency fluctuation and political instability and may not be suitable for all investors. These risks are often heightened for investments in emerging markets.
This material is for general information only and is not intended to provide specific advice or recommendations for any individual. There is no assurance that the views or strategies discussed are suitable for all investors or will yield positive outcomes. Investing involves risks including possible loss of principal. Any economic forecasts set forth may not develop as predicted and are subject to change.
The NASDAQ Composite Index measures all NASDAQ domestic and non-U.S. based common stocks listed on The NASDAQ Stock Market. The market value, the last sale price multiplied by total shares outstanding, is calculated throughout the trading day, and is related to the total value of the Index.
The S&P 500® Index: A free-float capitalization-weighted index published since 1957 of the prices of 500 large-cap common stocks actively traded in the United States. The stocks included in the S&P 500® are those of large publicly held companies that trade on either of the two largest American stock market exchanges: the New York Stock Exchange and the NASDAQ.
MSCI World Index: A broad global equity index that represents large and mid-cap equity performance across 23 developed markets countries.
Bonds are subject to market and interest rate risk if sold prior to maturity. Bond values will decline as interest rates rise and bonds are subject to availability and change in price.