


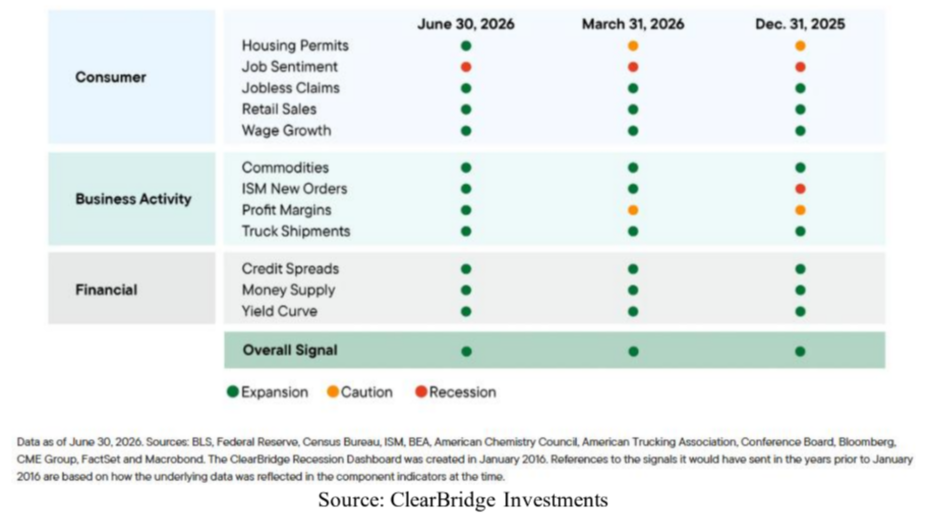
According to ClearBridge Investments, although markets often pause to digest after large gains, history suggests these episodes usually prove fleeting, meaning major indexes could move higher in the second half of 2026. Below is a summary of the most recent Recession Indicators report:
Key Takeaways:
According to Jeff Schulze, CFA, Head of Economics & Market Strategy with ClearBridge Investments:
- Several economic clouds receded last quarter with the labor market turning the corner and oil prices returning to pre-conflict levels. Combined with the strong overall green signal from the ClearBridge Recession Dashboard, ClearBridge Investments believes the U.S. economy remains on solid footing. o
- While the S&P 500 has been in a higher valuation regime since the pandemic, earnings strength has single-handedly powered the market rally, a trend ClearBridge Investments believes will continue.
U.S. Recession Risk Dashboard
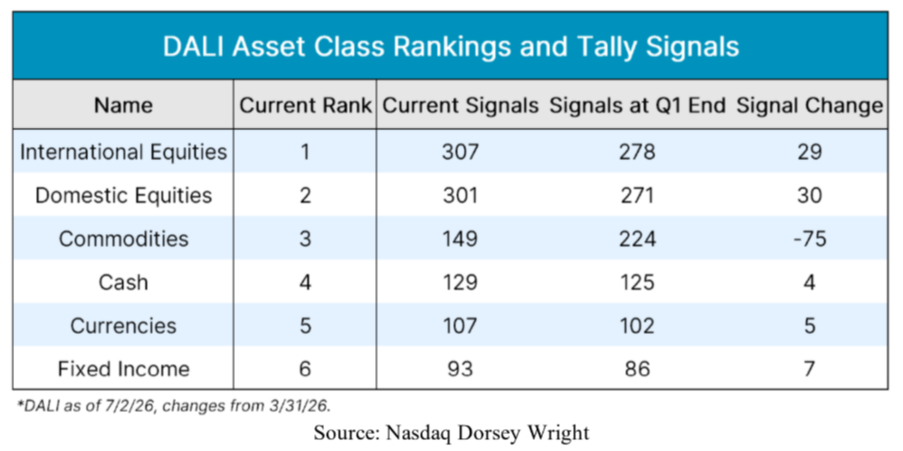
It was a good quarter for investors, as stock markets pushed higher on both the domestic and international front. The Total U.S. Stock Market Index rose 15.3%, marking its best quarter since Q2 of 2020. Meanwhile, the MSCI ACWI ex-U.S. International Index gained 11.2%, making International Equities the best performing asset class YTD. Not every asset class fared as well, though. Fixed Income (bonds) was relatively flat, with the Total Bond Market Index dropping 0.3%. Lastly, Commodities took the biggest hit, as the Continuous Commodity Index dropped 5.4%, driven by weakness within energy commodities and precious metals.
The DALI (Dynamic Asset Level Investing) Indicator is designed to help us identify where strength (or weakness) resides across and within the broad asset classes. From an asset class perspective, market leadership was consistent in Q2, with the strongest asset classes continuing to demonstrate relative strength. As a result, there were no changes in DALI’s asset class rankings. That said, we did see some movement within the tally signal counts for different groups, which is what the rankings are based on. Domestic Equities and International Equities each gained around 30 Relative Strength signal tallies. Meanwhile, Fixed Income, Currencies, and Cash each picked up fewer than 10 signals. The only asset class to lose ground in the quarter was Commodities, dropping a whopping 75 signals despite maintaining its third-place ranking, with it now within 20 signals of being overtaken by Cash. Overall, the strength of stocks at the top of DALI highlights a risk-on posture, especially as risk-off areas like Fixed Income sit in the bottom half of rankings.
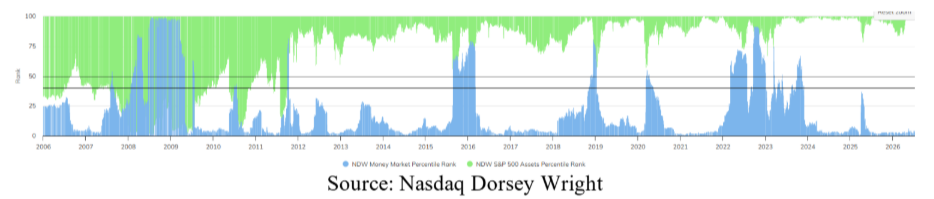
The current reading for the PR4050 is: U.S. Equity Core = 97.89% & Money Market = 3.52%. For the PR4050 indicator to trigger and alert us when we should consider moving to cash, U.S. Equity Core must be 40% or below and Money Market must be 50% or above.
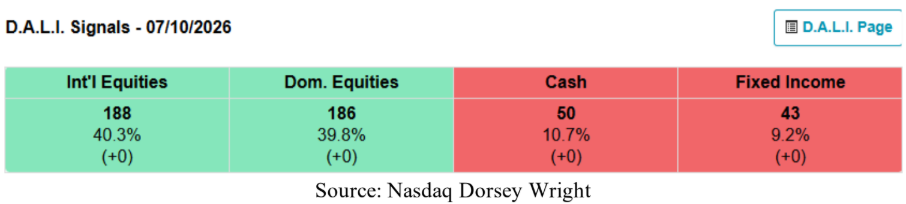
Below is the most recent D.A.L.I. (Dynamic Asset Level Investing) Indicator showing International Equities and Domestic Equities in the top two spots, while both maintain a commanding lead over Cash and Fixed Income.
P.S. If you believe this information would be of benefit to anyone you know, please share this communication with them. Also, if you, or someone you know, would like to be added to the weekly market update, please click here to provide us with the e-mail address.